Latest Data Tells Us What We Already Knew
It hasn’t rained much. The latest data collected from our rain gauges and moisture sensors hasn’t uncovered any surprises. Rainfall has been very low and the ground is very dry. April saw the lowest rainfall since we started collecting data at the start of 2024. The first half of 2024 was wetter than usual which gives a distinct contrast to the same period in 2025. The table below shows monthly rainfall for our Upper Twizell rain gauge located in South Moor. Hover over the bars to see each monthly total in millimetres.
| Month | Rain_001 totals (mm) |
| Feb-24 | 60.1 |
| Mar-24 | 69.7 |
| Apr-24 | 102.2 |
| May-24 | 128.2 |
| Jun-24 | 27.8 |
| Jul-24 | 104.2 |
| Aug-24 | 34.1 |
| Sep-24 | 111.7 |
| Oct-24 | 101.1 |
| Nov-24 | 16.2 |
| Dec-24 | 72.9 |
| Jan-25 | 69.7 |
| Feb-25 | 31.1 |
| Mar-25 | 18.5 |
| Apr-25 | 5.7 |
| May-25 (to 19th May) | 2.4 |
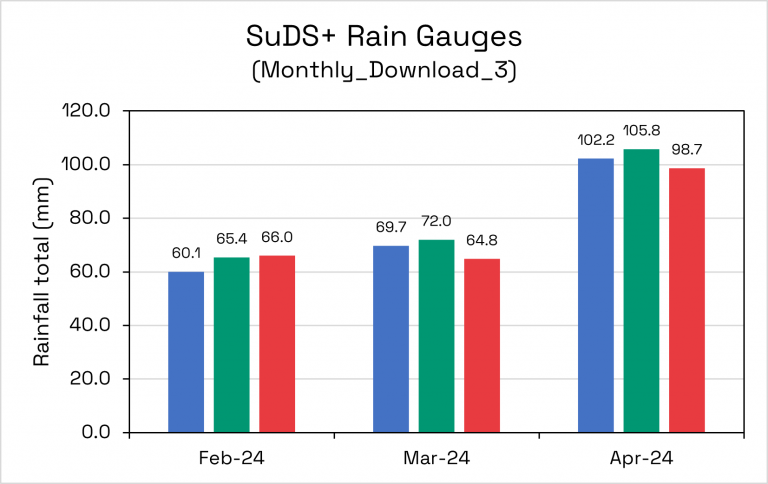
A direct comparison with 2024 and 2025 below.
| Apr-24 | Apr-25 | May-24 | May-25 (to 19th May) | |
| South Moor | 102.2mm | 5.7mm | 128.2mm | 2.4mm |
| Town Centre | 105.8mm | 5.6mm | 124.6mm | 1.8mm |
| Craghead | 98.7mm | 4.9mm | 102.0mm | 2.2mm |
Graph showing all rain gauges since inception

The graph below shows the moisture content in the soil at our site in South Stanley. The red line shows the moisture in the soil decreasing and the green line temperature increasing.

For April and May this year we are currently on average 7.5mm. Last year this figure was on average 220mm. Northumbrian Water has already advised customers to use water responsibly due to low rainfall and high temperatures compared to previous years. Dry weather can also cause flash flooding as water from heavy rainfall will run straight over dry/hard ground in a similar war to tarmac or other impermeable surfaces. It will be an interesting few months ahead seeing if these trends are repeated.