
Rain Gauges: A Full Year Of Data Collected
On Monday 20th January we collected the latest set of data from our rain gauges. This completed a full year of operation giving us a chance to look at the full year in comparison with expected rainfall. Three rain gauges are in place covering the East, Central and West of our study area. Each rain gauge has 2 graphs below. Graph one shows the accumulated rainfall on the orange line rising throughout the year with daily totals on the blue lines. Graph two provides a month to month rainfall total. No complete January’s have yet to be recorded.
Rain Gauge 1 Upper Twizell


Rain Gauge 2 South Stanley


Rain Gauge 3 Craghead


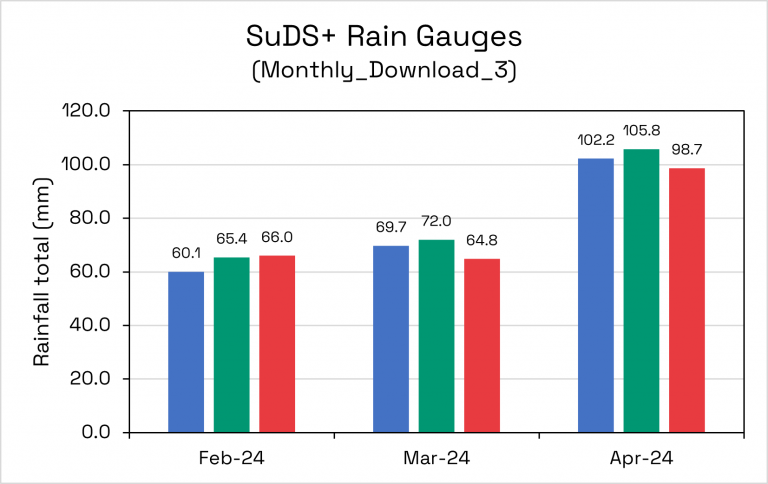
Finally monthly comparison of all three rain gauges together with Blue: rain gauge 1, Green: rain gauge 2 and Red: rain gauge 3

Tables below show the figures for each rain gauge from inception (380 days) including the 3 wettest days

The figures below are total rainfall 06/01/2024 to 05/01/2025 one calendar year
- RAIN_001 = 914.7mm
- RAIN_002 = 913.8mm
- RAIN_003 = 839.2mm
For comparison, the Standard Average Annual Rainfall (SAAR) for our study area is 725mm, not necessarily Jan-Jan like our data but this still works for comparison. Rainfall for November-24 seems very low yet we are well above the average rainfall totals. This could be explained by how wet May, June and July were in comparison with other years?
Our rain gauges have each tipped over 4,700 times so far and data precision seems to be accurate so the team are confident in our observations so far. Snow and ice in our exposed rural locations may be an ongoing problem but their is being monitored.

Thanks to Ellis Sinclair-Kent for his ongoing support for the rain gauge project.


Brill. We’re trying to do the same in the upper river Welland Catchment for flood warning after a 60 mm fell in 12hrs and flooded our properties. Local rain was not heavy.
What gauges do you use? We’re trying wifi linked Rainpoint. Thanks
Harborough Flood Action Group Leicestershire
Hi Bruce,
We went for non wifi with manual downloads. The team balanced power requirements, reliability, logging memory, staff resources, and end use of the data (longer term trends for research project rather than flood warning and action). WiFi is also poor in some parts of the study area. We use SBS 500 rain gauges with Tinytag loggers. They record the number of tips every 2 minutes and the memory is full after about 40 days. http://www.emltd.net/sbs.html