Two Years of Rain: What Our SuDS+ Gauges Are Telling Us
From 6th January 2024 to 11th January 2026, three small instruments quietly recorded every drop of rain falling across the SuDS+ catchment. Together, they’ve given us a clear picture of how rain behaves across Stanley South.
A milestone worth celebrating
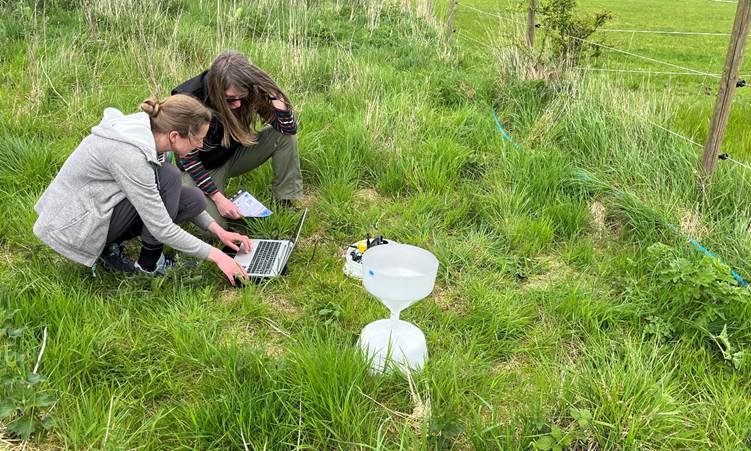
Over two years, our three rain gauges have logged rainfall every two minutes, without a single gap in the record. That means that tens of thousands of individual measurements have been made, adding up to around 23,000 ‘rain gauge bucket tips’ across the network. Our team has been keeping a close eye on the gauges to make sure they have been functioning as planned.
For most of us, rain is something we notice only when it disrupts our plans. For SuDS+, it’s the raw material that shapes flood risk, green spaces, and drainage design. This dataset marks an important step forward in understanding how water moves through the area.
Three gauges, three slightly different stories
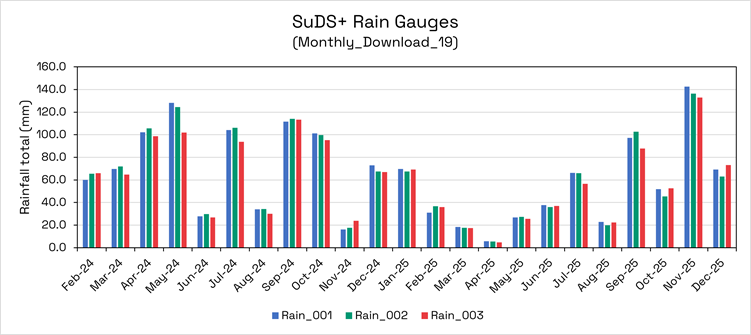
Although the gauges are only a few kilometres apart, they don’t always see the same rain.
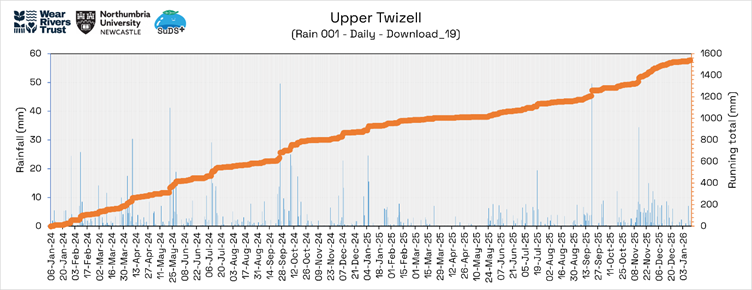
- Rain 001 – South Moor (to the west, on higher ground): Often the wettest of the three. Monthly totals here are regularly higher, especially in autumn and early winter. This fits with its higher elevation and more exposed position.
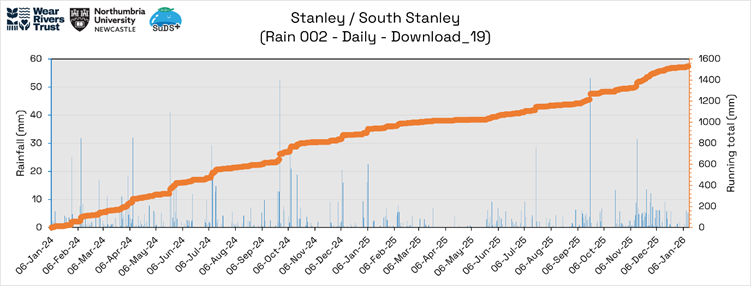
- Rain 002 – South Stanley (our urban gauge): A useful benchmark for rainfall where people live and where hard surfaces dominate at the top of the hill. Its totals usually sit between South Moor and Craghead, showing what the ‘typical’ rainfall looks like in the built-up area.
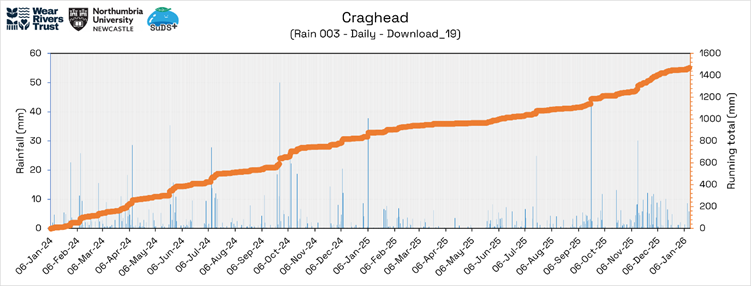
- Rain 003 – Craghead (to the east, in a lower and more sheltered area): Generally a slightly drier site, but still capable of seeing high downpours like the other two sites. Being closer to the catchment exit, this gauge helps us understand what rain is actually feeding into downstream areas.
Seeing these differences side by side reminds us that rainfall isn’t uniform, even across a small area.
It’s not just how much rain falls, it’s when
The daily records reveal another important pattern; most rain falls in short bursts, not steady drizzle. Many days record just a few millimetres, while a handful of intense events account for a large share of the total.
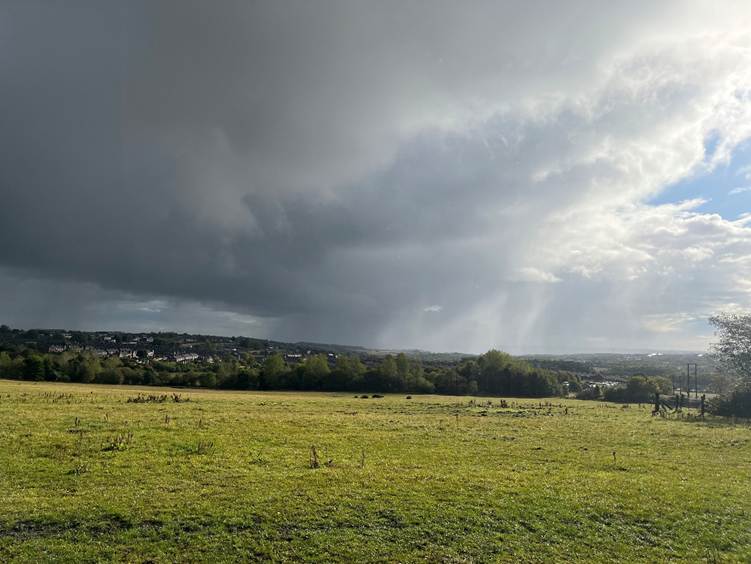
On the charts, these show up as sharp spikes, sometimes 30–50mm in a single day. These are the days that matter most for surface water flooding, overwhelmed drains and ponding on roads, which may affect your neighbourhood.
In contrast, there are also long dry spells, particularly in spring and early summer 2025, when very little rain fell for weeks at a time. More recently we also had a lot of snow and ice (January 2025) which can be harder to record accurately.
Autumn stands out
Across all three gauges, autumn months (September to November) consistently deliver the highest rainfall totals. Late 2024 and late 2025 both show pronounced increases, with several months exceeding 100mm. November 2025 was definitely much wetter (in fact, ten times wetter!) than November 2024 though.
These seasonal and annual patterns are exactly why SuDS features like swales and other permeable surfaces are designed with autumn and winter storms in mind.
Why this matters for SuDS+
This growing dataset helps us:
- Design smarter drainage and benefits for residents: Knowing how rainfall varies across the catchment allows SuDS features to be sized and located more effectively.
- Plan for extremes: Short, intense storms are often more important than monthly averages when it comes to flood risk.
- Track change over time: As the record lengthens, we’ll be able to determine how the Twizell river catchment behaves, pair the data with other types of observations (e.g. river level and flows), and most importantly, understand how our SuDS+ sites (currently in South Moor and South Stanley) are behaving before, during and after installation.
The rain gauges give us local evidence, rather than relying on distant weather stations that may not reflect what’s happening on our streets and green spaces.
What’s next?
As the dataset continues to grow, we will start digging deeper by comparing storms across the three gauges, linking rainfall to water levels and surface flooding, and sharing what we learn with residents. We will also be pairing the data with our wider monitoring activities which seek to quantify social and other environmental benefits.
Rain may be something we all grumble about, but thanks to these three small gauges, it’s also becoming one of the most valuable SuDS+ tools we have for building a more resilient Stanley South.
We will keep listening to the rain. Two minutes at a time.